-3.png?length=1000&name=Inpixon%20LinkedIn%20Banner%20August%202025%20(2)-3.png)
In smart warehouses that utilize the Internet of Things (IoT) to gain insights on operations, all assets and personnel are tagged with sensors to be able to track data. Overtime, time-stamped data is collected on their positions, movements and how long they spend in certain areas. This information can then be analyzed to discover patterns in the warehouse, and get insights on dwell times, throughput and potential bottlenecks. In this article, we’ll dive into how an RTLS platform can help you gather and analyze this data to build strategic insights on how to optimize your operations.
How Do Location-Based Analytics Work?
To gather analytics on your warehouse processes, you need both hardware and software to make it happen.
In terms of hardware, you would first need an asset tracking tag or sensor that is portable and able to relay locational information and communicate with reader devices like anchors. These asset tags and sensors can then be attached to moving objects in your warehouse, including vehicles, equipment, assembly lines or personnel. The Inpixon Asset Tag is a long-range chirp spread spectrum (CSS) enabled device that’s designed for industrial environments.
Next, for your software component, you need an IoT platform that can aggregate, process and display the location data collected from your asset tags and sensors in ways that are useful for optimization. With an IoT platform that’s integrated with your asset tags and sensors, you can gain insights in a variety of scenarios, such as tracking the location information of forklifts to uncover when & why they encounter traffic. You can also see how processes work in different zones or stages of production, from packaging and storage to delivery for different variations of your product that need to be produced, stored and shipped together.
Delays due to unresolved inefficiencies can cost valuable time and money in industrial processes. Below, we’ll show you how an integrated IoT platform can help you identify bottlenecks in your production processes and create solutions to eliminate them.
How an IIoT Platform Helps Streamline Warehouse Process Planning
Track Pathways & Find Optimal Routes with a Trail Report
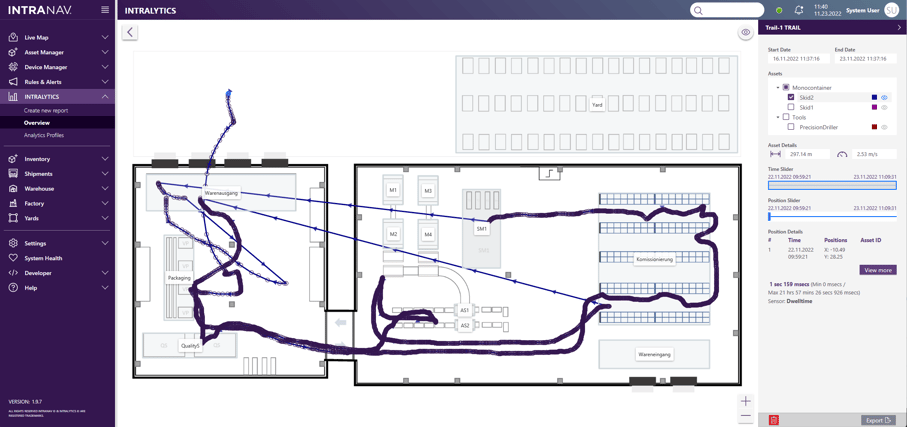
A trail report, or spaghetti diagram, is a tool that tracks how assets move throughout the warehouse at any specific time, with the ability to see exactly which assets were involved and if there was any dwell time. Outdoor reports and Yard Management solutions are also available to track and analyze transport routes, parking and loading areas, to increase transparency with assets and vehicles being stored outside.
What Insights Can a Trail Report Offer?
By tracking the path of specific assets, such as the journey of water bottles being manufactured in the facility, you can see exactly how they flowed and where there were inefficiencies. For example, a trail path can show that the water bottle lids may be produced much faster than the bottles and are therefore always being stored in a hallway and blocking a path.
Warehouse supervisors can then decide to dedicate a storage zone for the lids and know exactly when and where to move them to the next assembly line with the rest of the water bottles thanks to the visual trail with timestamps. They may also notice that the water bottles are being transported through a path that takes 5 minutes longer than needed, and optimize that route.
Analyze Bounded Areas with a Zone Report
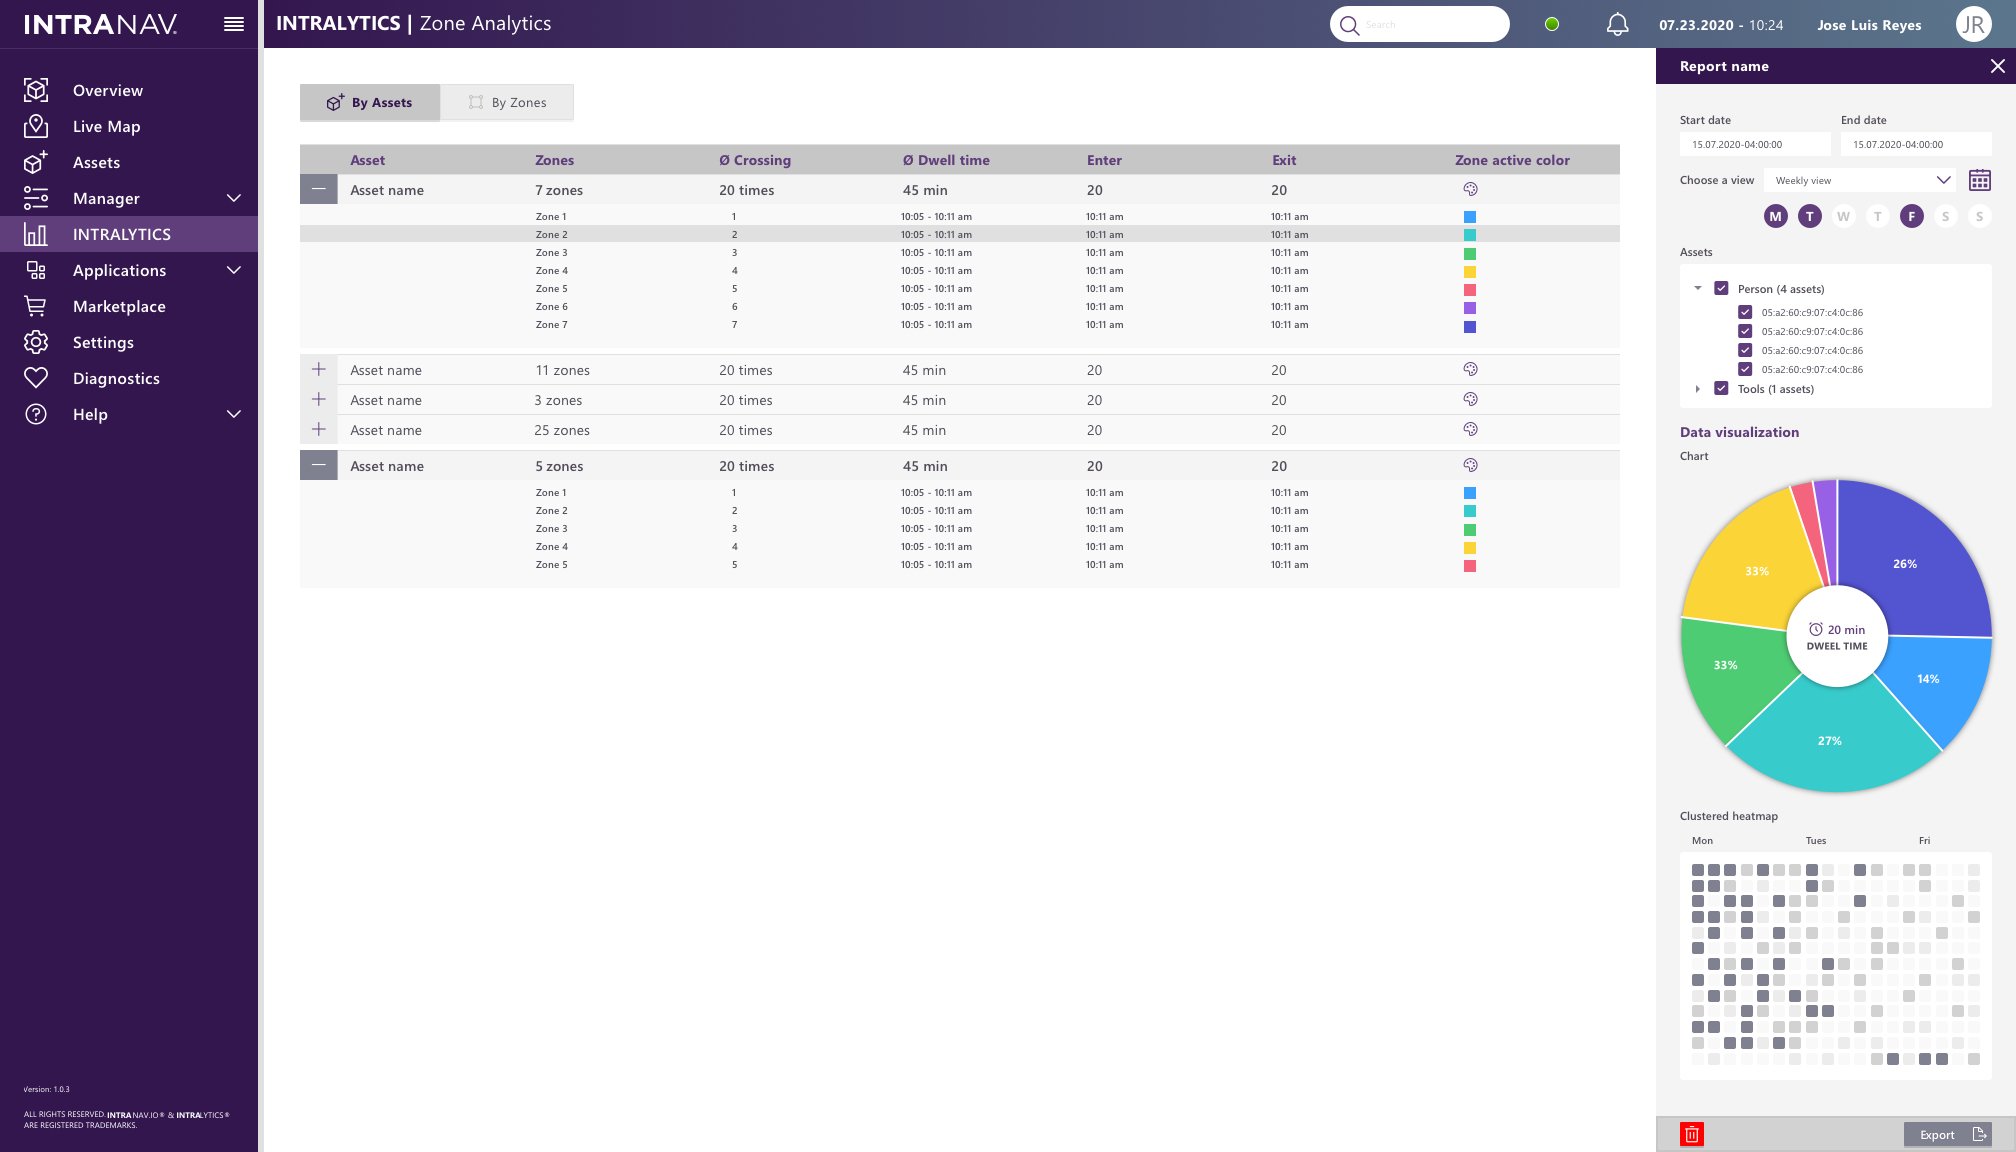
The zone report compares and analyzes which zones in the warehouse operate most efficiently, with specific information on assets, data visualization charts and information on which days of the week were most productive.. This allows the customer to smooth and level their processes and resources against the background of better utilization. The pattern recognition and the innovative representation enable the customer to identify bottlenecks and process deviations quickly and easily.
What Insights Can a Zone Report Offer?
Zone reports allow organizations to categorize specific areas of the warehouse and gain insights on each one. For example, zone 4, which could oversee assembling water bottles, may always take longer than all other processes. This could be the result of waiting for the different parts to come, because a specific machine isn’t working up to par, or because there are fewer workers in that zone on Fridays. This delay affects the entire production time of the water bottles, so being able to pinpoint where the issue is happening helps increase efficiency.
Visualize Dwell-Times and Process Bottlenecks with a Heat Map Report
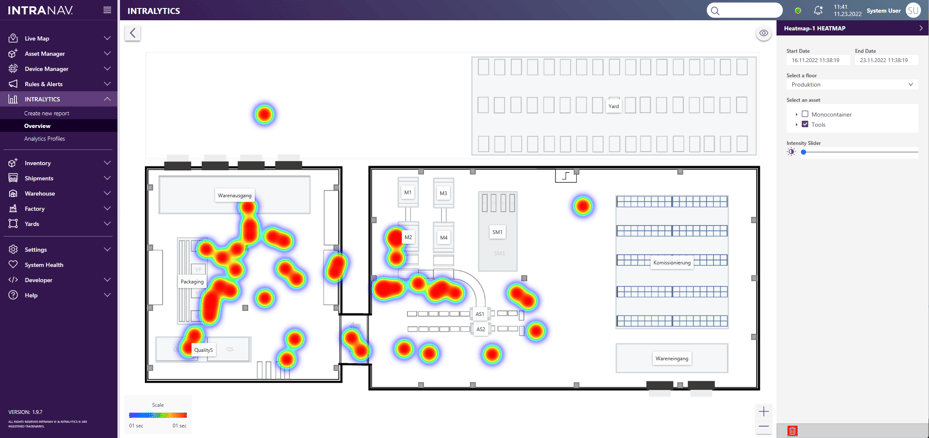
Heatmaps visualize and represent the amount of time spent in certain areas, identifying inefficient workflows, long waiting times or stuck processes.
What Insights Can a Heat Map Report Offer?
Heat maps are a great visual tool to see where assets or people are spending extra time, as opposed to having to view a list of numbers with dwell times. With the map you can see exactly where the hot spots are, calculated by time spent in those areas from anything that is tagged in the warehouse. So if a specific corner of the warehouse is prone to extra traffic, it may mean that warehouse supervisors change forklift routes, open extra entrances or create storage zones for merchandise blocking the way.
Understand How Assets Move Throughout the Warehouse with a Material Flow Report
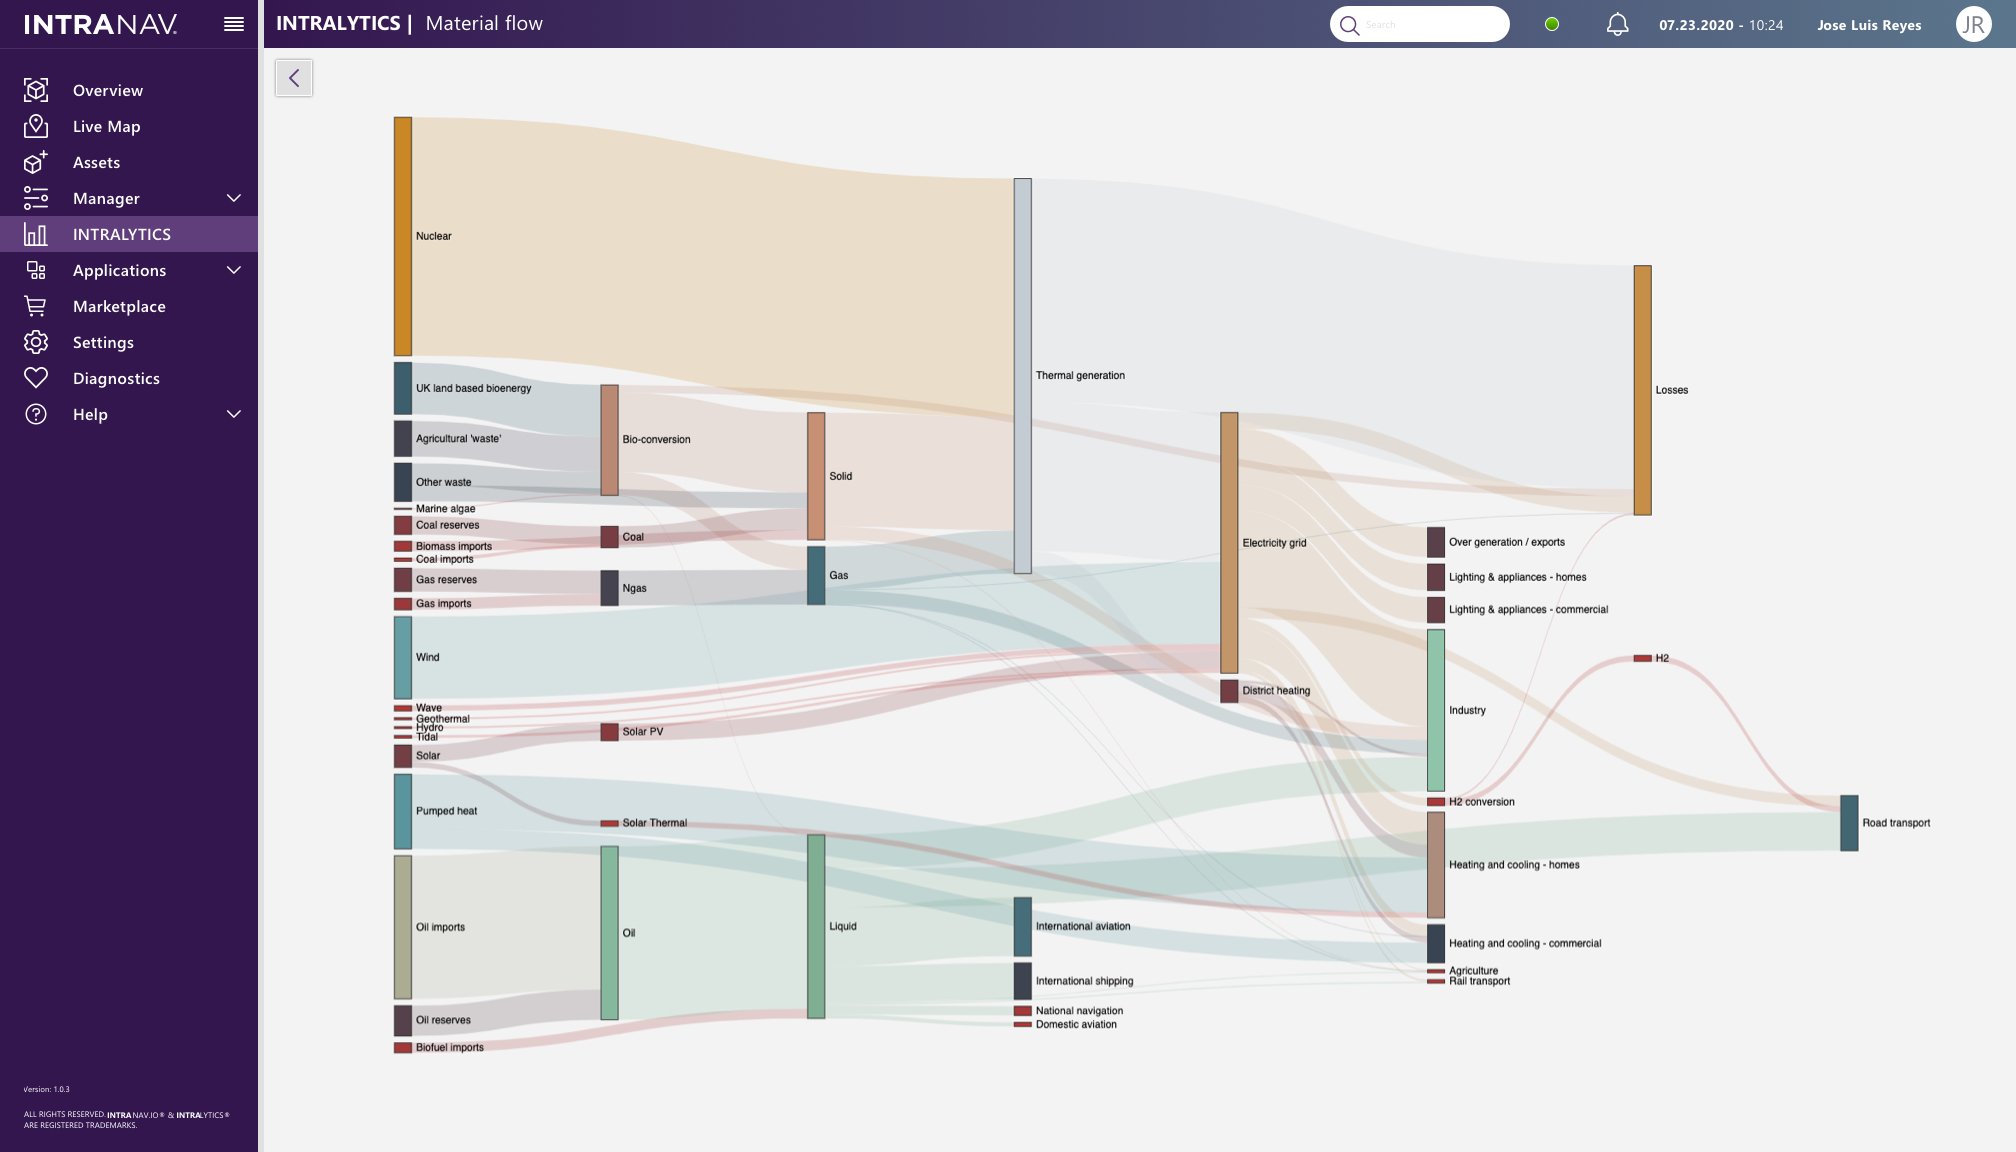
The material flow report shows how assets move throughout the entire warehouse from zone to zone. By setting pre-defined goals and getting information on when assets entered and exited an assembly line or how long a specific process took, you can identify where production is running overtime and take action. Included in this report is a Sankey diagram, which is a graphic representation of quantity flows and is considered one of the most important tools for visualizing material flows as well as inefficiencies and potential savings when dealing with resources.
What Insights Can a Material Flow Report Offer?
By being able to see exactly where all your assets are moving throughout the warehouse, you can make decisions in real-time and find the precise location of an asset easily. Without this, a worker would have to manually search an area for a specific product, which could result in a lot of time wasted. So if product A is entering an assembly line instead of product B, on-site workers can quickly locate and identify which products are on the wrong assembly line and make a change before lots of time and resources are wasted.
Get Real-Time Location Data with an Analytics Dashboard
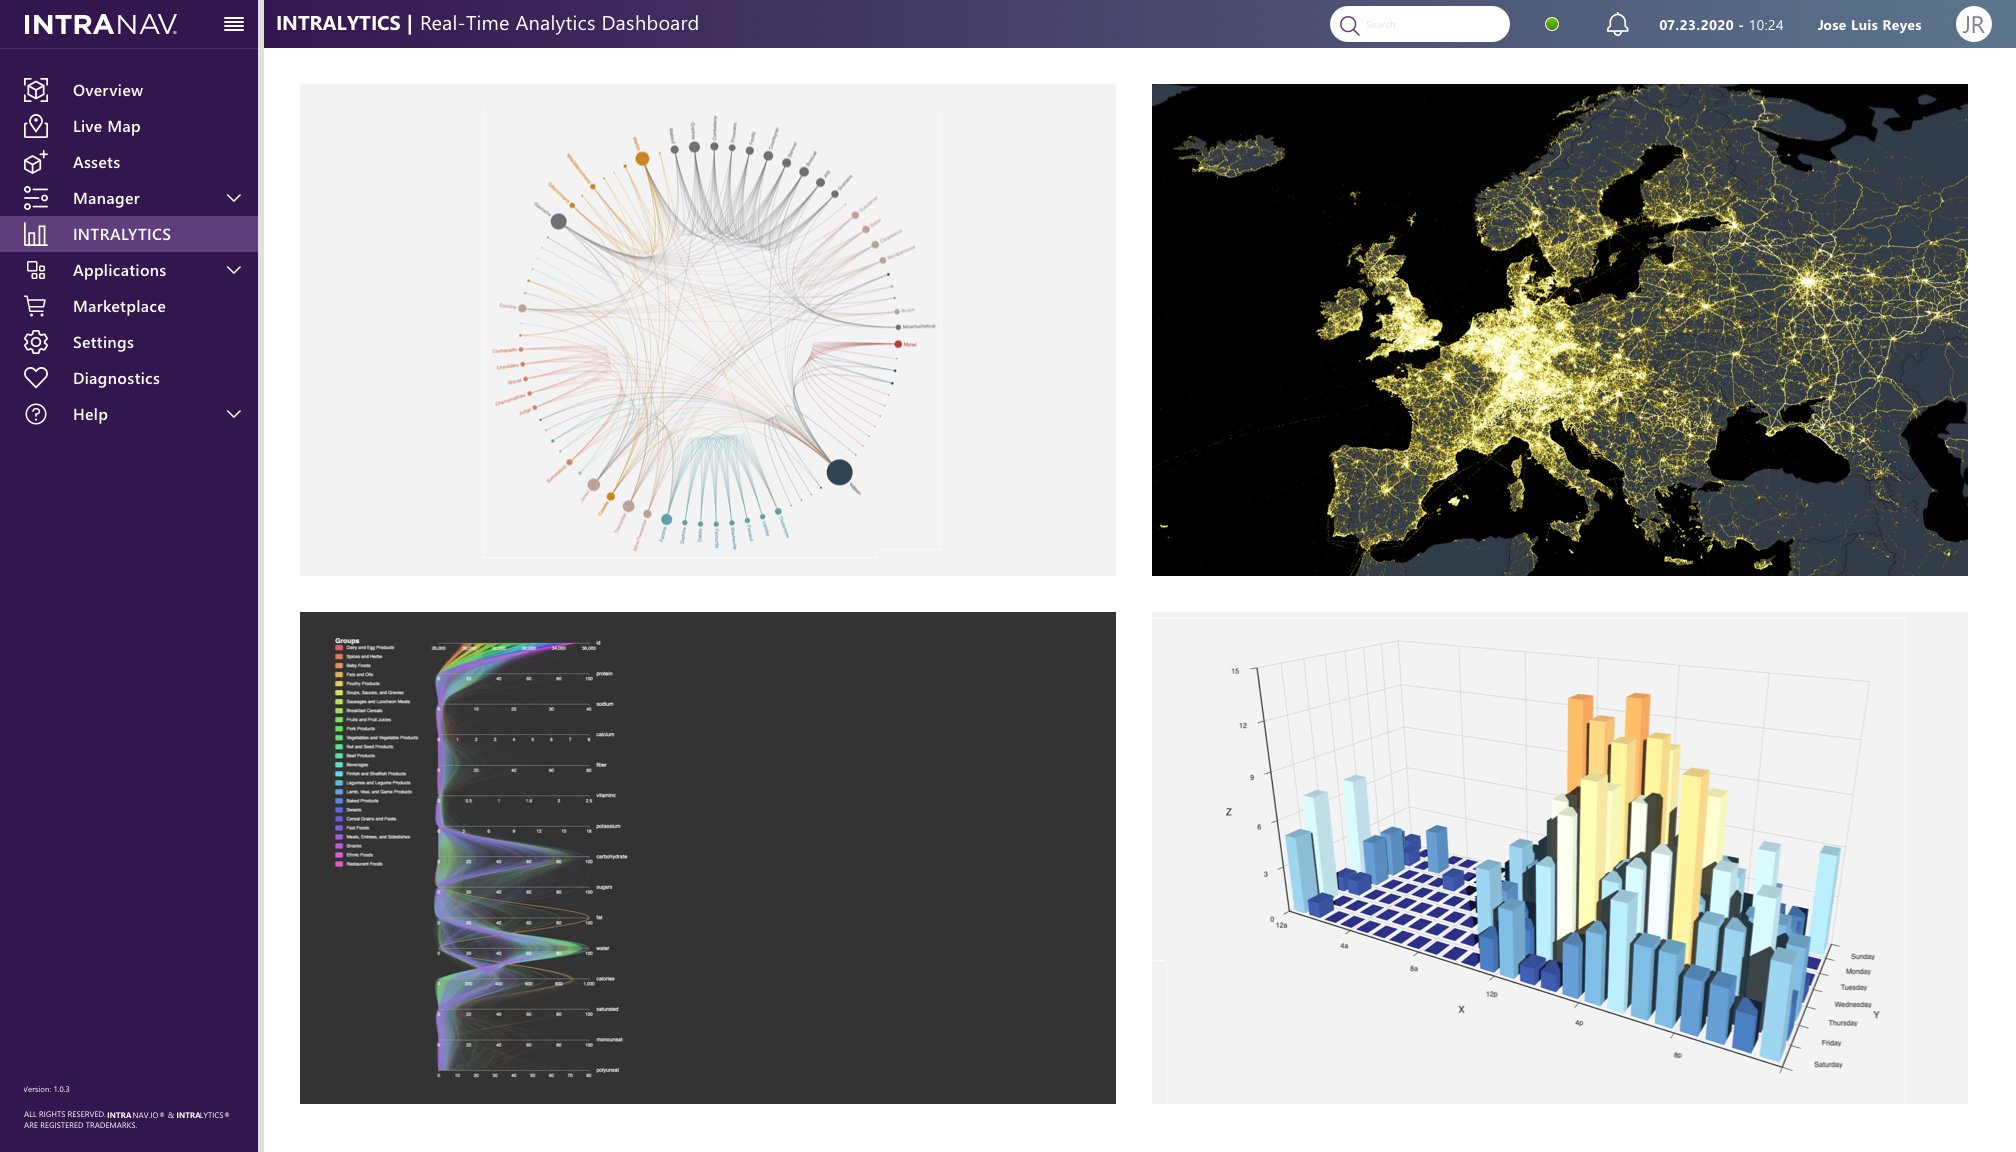
Analytics dashboards provide real-time analytics in a variety of charts and formats to visualize data and make it easier to process. If data isn’t understandable, you can’t make the most out of your investment, which is why it’s important to invest in an analytics dashboard that prioritizes the user experience.
What Insights Can an Analytics Dashboard Offer?
An analytics dashboard is where users can gain access to a variety of visual charts and tools to gain a holistic view of how warehouse operations are going. Dashboards that can be integrated with Enterprise Resource Planning (ERP) or Warehouse Management Systems (WMS) add another layer of connectivity to warehouse production processes. So if certain information is needed on the number of items produced per month to compare with last year’s numbers, decisions can be made on where the company is performing, and where action needs to be taken.
Key Benefits of Location-Based Analytics
Do more in less time: With visibility on what processes are taking too long and what can be optimized, making deliveries or unloading storage can be done in a much shorter time, and then more can be accomplished in the warehouse.
Save on operational costs: By gaining data on bottlenecks and blockers, taking action to make these processes more efficient (like optimizing assembly lines or using predictive analytics to prevent machine downtime) saves energy and overall costs, boosting ROI.
Prevent errors – When processes aren’t optimized, errors like traffic jams can cost time and money. With location analytics, you can optimize routes by using a hybrid fleet (and Fleet Management solution) to control the routes of forklifts to make sure they don’t run into each other or cause any traffic.
Interested in discovering more about your production processes with real-time analytics? INTRANAV, an Inpixon company offers an all-in-one solution on its IoT platform INTRANAV.IO and its analytics tab INTRALYTICS. Book a demo session with us today!