






Order books for turbines, transformers, and grid equipment reach years ahead, and much of the new capacity is planned inside existing plants. Most of those plans count machines, bays, and shifts. Very few count the hours that disappear between them.
This article does that math for a typical plant, with every assumption on the table, so you can replace them with your own numbers. It looks at two levers: the time people lose, and the time your most important stations stand still.
The capacity nobody calculates
Machine capacity is measured to the decimal. OEE, utilization, and cycle times are reviewed every week. What happens around those machines is measured far less precisely, if at all: people walking to find a part, waiting for material, or calling planning to ask where an order is, and assembly bays sitting idle because one component did not arrive in time.
None of this shows up as a line item. It is spread across hundreds of people and thousands of small interruptions, which is exactly why it is easy to underestimate.
Lever 1: the time people lose
Take a mid-sized energy equipment plant with these assumptions:
- People: 250 employees in assembly, test, and intralogistics
- Working days: 220 per year
- Productive hours per person: 1,650 per year
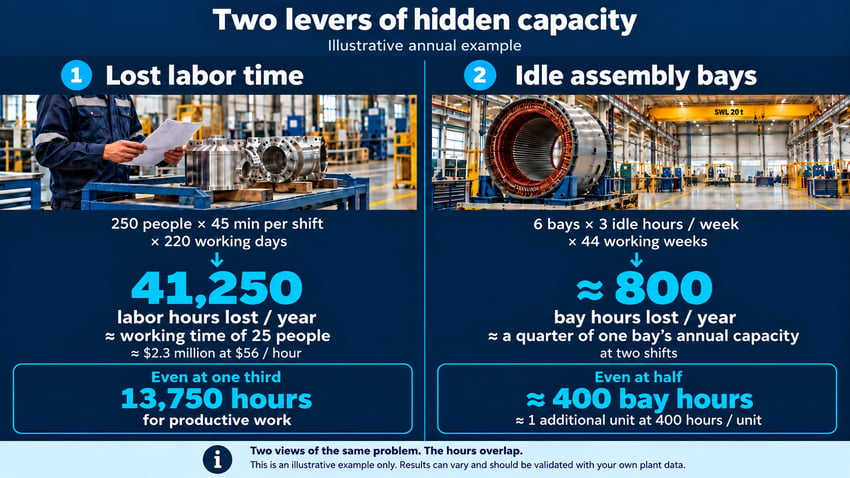
- Time lost to searching, waiting for material, and clarifying status: 45 minutes per person per shift
Our own look at high-mix manufacturing puts search time alone at 10 to 15% of a shift. This example uses the lower end, about 45 minutes, and includes waiting and clarifying status in that figure. Kaizen Institute's estimate that direct operators spend only 30 to 50% of their working time on value-adding work suggests the real number is often higher.
- 0.75 hours × 220 days × 250 people = 41,250 hours per year
- That equals the working time of about 25 people
At a fully loaded labor cost of around $56 per hour, that is roughly $2.3 million per year in paid time that produces nothing.
This is not an argument for cutting jobs. It is time your existing team could spend building units instead of looking for what they need to build them.
Lever 2: the time your key stations stand still
Lost labor hours cost money. Lost hours at the bottleneck cost output. In most energy equipment plants, the constraint is not the workforce as a whole but a small number of stations: main assembly bays, test stands, the crane that serves them. An hour lost there is an hour lost for the whole plant.
Same plant, two more assumptions:
- Main assembly bays: 6
- Idle time per bay caused by missing material or a late handover: 3 hours per week
- 6 bays × 3 hours × 44 weeks = about 800 bay hours per year
That is roughly a quarter of the annual capacity of one bay running two shifts. If a typical unit occupies a bay for 400 hours, those 800 hours equal two additional units per year, at the station that decides how many units leave the plant.
"Every plant knows how long its machines run. Few know how long their parts wait. That is where the hidden capacity sits."
David Almström, CEO, Inpixon
What the numbers mean together
The two levers overlap. When a bay waits for a part, the team at that bay waits too, so the hours should not simply be added up. They show the same problem from two angles: one in cost, one in output.
Even if you recover only a third of the lost labor hours and half of the bay idle time, that is still one additional unit at the bottleneck and around 13,750 hours for other orders. For equipment that sells for several million dollars per unit, the output side of the equation is far larger than the labor cost.
How to increase production capacity without adding machines
Lost hours do not come back through more discipline or more meetings. They come back when the systems in the plant act on what is happening on the floor, without anyone having to look, ask, or scan.
An RTLS platform does that in several ways:
- Faster finding: Kits, carriers, tools, and large components are found right away instead of by walking the hall.
- Automatic bookings: When tagged material moves from one zone to the next, the move is posted to the ERP or MES, so planning works with the current state rather than the last scan.
- Missing parts flagged early: If a required part is not at the bay a defined time before the planned start, the material handler gets a task and the planner a warning.
- Queues caught while they form: If a unit waits in front of a test stand longer than planned, the supervisor gets a signal in time to rebalance the shift.
- Stations flagged before they run dry: Work stations at risk of running out of material are flagged early, so supervisors can act before work stops.
- Audit trail as a by-product: Every zone entry is time-stamped, so less time goes into reconstructing what happened for quality or customer audits.
Some of these mainly give back labor hours. Others protect the bottleneck. Together they turn the two levers above into something a plant can act on.
Before you hire or build
Hiring is limited by the labor market. In Germany, a TMG Consultants study lists the skilled labor shortage among the main pressures on intralogistics, and in the US, Deloitte and The Manufacturing Institute expect up to 1.9 million manufacturing jobs to remain unfilled by 2033. A new hall takes years to plan and build. Recovered hours are available in the plant you already have.
Not every lost hour can be recovered, so treat the example as an order of magnitude and check it against your own plant.
How to calculate the production capacity you already have (and a checklist)
Lever 1: labor hours
Lost hours per year = people × working days × minutes lost per shift ÷ 60
Lever 2: bay hours
Lost bay hours per year = number of key stations × idle hours per week × working weeks
Units equivalent = recovered bay hours ÷ bay hours per unit
Revenue equivalent
Revenue equivalent = additional units × your price per unit
In a sold-out market, every additional unit can be sold. Use your contribution margin instead of the price if you want to see the effect on profit.
If you do not know the minutes or idle hours, a two-week sample at one station is usually enough to see whether the numbers are worth a closer look.